A manual QA process, rebuilt as an app inside Fabric.
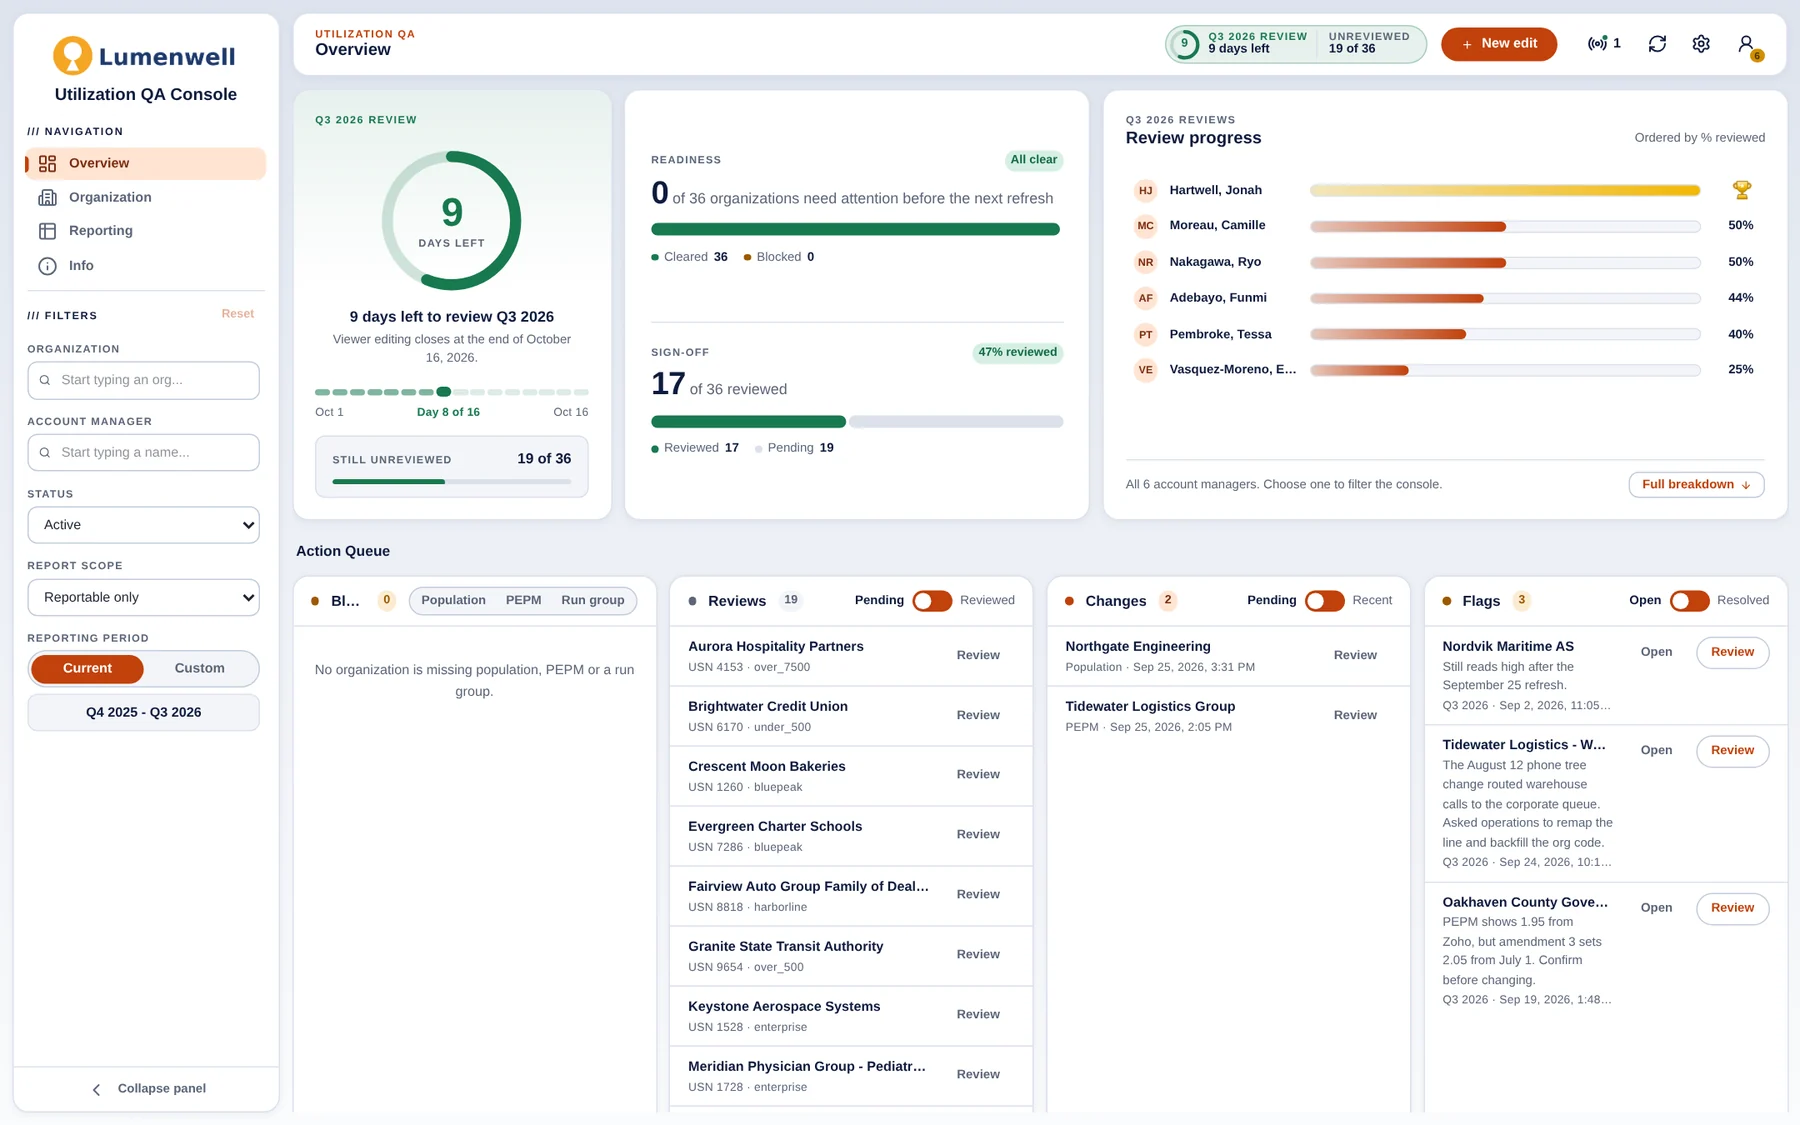
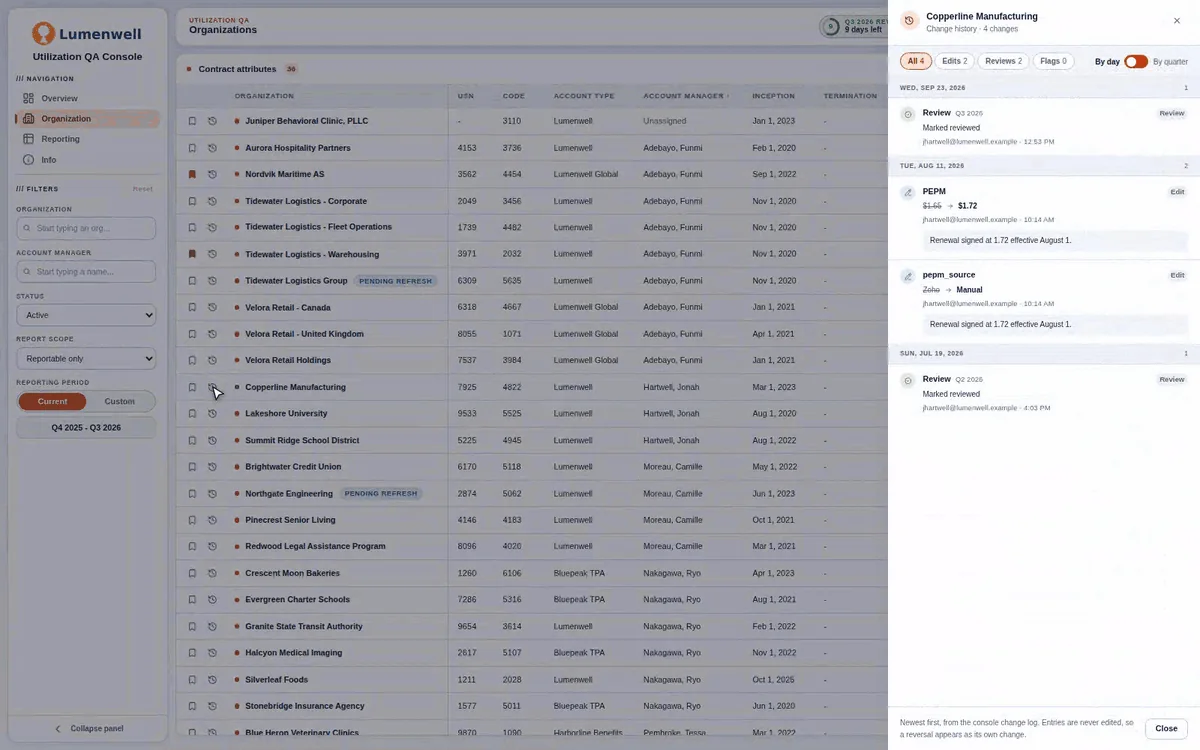
Utilization QA Console: a review app on the same semantic model as the reports, so the team checks and corrects client data before any report goes out.
- $250K+
- of workload absorbed by the app
- 2 roles
- of engineering work covered after both engineers left
- 1 model
- behind the reports, the app and client PDFs
Client utilization reports depended on a manual QA process that was slow, easy to get wrong, and carried by two engineers. When both left, the work had nowhere to go, and every correction still had to land in the reports before the next refresh.
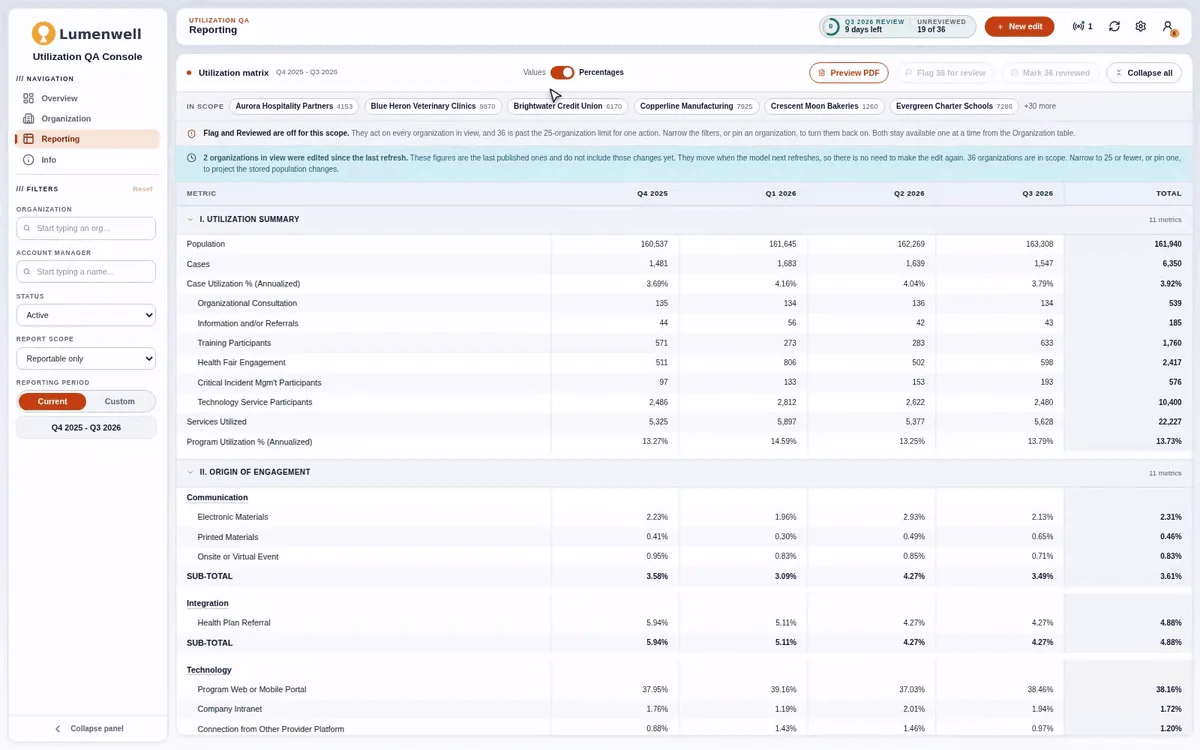
- 1An app inside Fabric. It reads the same semantic model as the reports, so the numbers on screen are the numbers clients see.
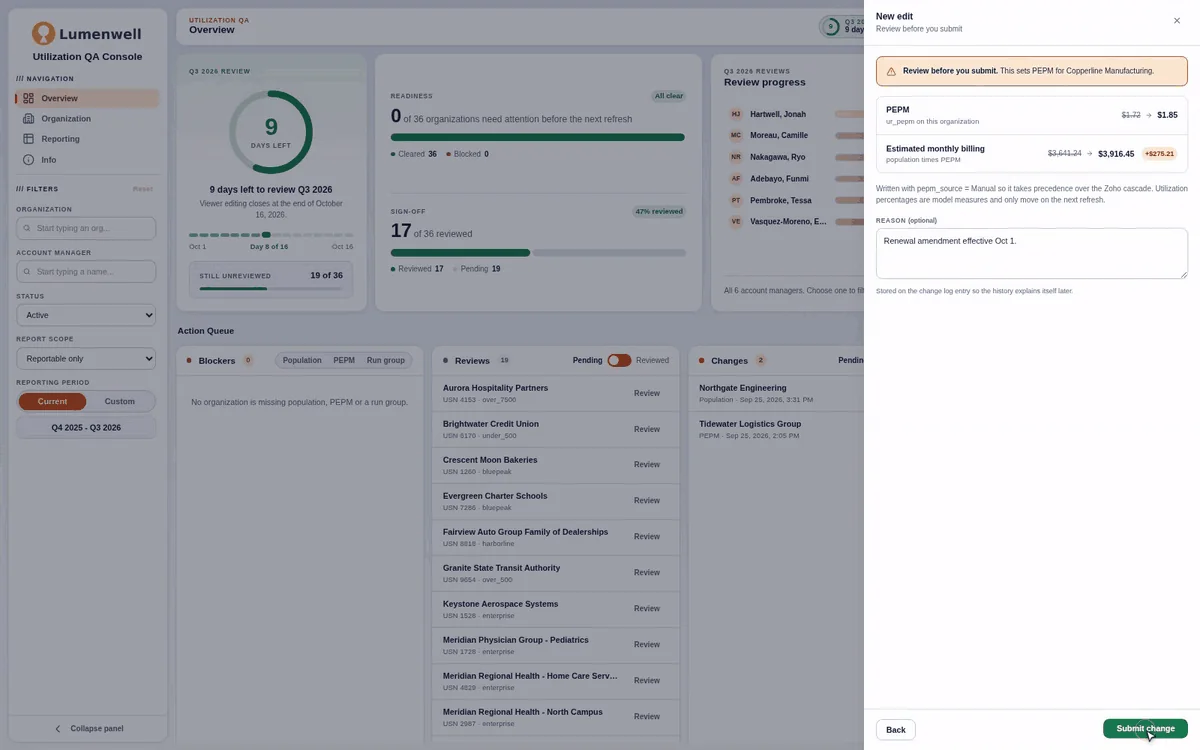
- 2Edits with an impact preview. The before and after, including billing impact, show before anything is written.
- 3A change log with undo. Corrections write to Fabric SQL with the value they replaced and a reason, and flow back into the lakehouse first.
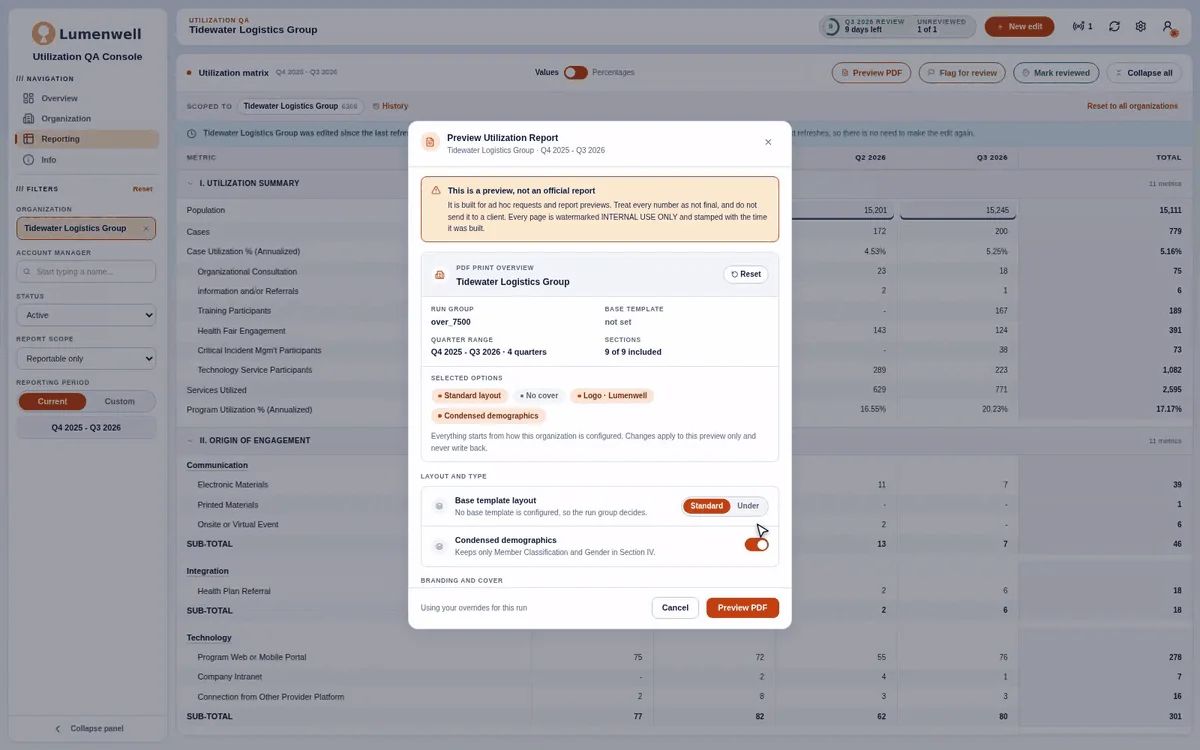
- 4Client PDFs on demand. Built in the browser from the model, watermarked until they’re final.
Review cycles now run from one screen, every correction can be traced and undone, and the app absorbed more than $250K of workload.
Rebuilt on fictional data, screen by screen.
Read with DAX, write through GraphQL, closed on the next refresh.
The app reads and writes through two different systems. Step through a correction, or let it play.
Read and write are two systems
The loop closes on the next refreshThe model now says 4,420. The app, the reports and client PDFs agree.
ResultQ3 2026 covered lives 4,420 reports · app · client PDFs agree
- UtilizationSemantic model read · DAX
- QA consoleApp in Fabric write · GraphQL
- qa_consoleSQL database auto-mirror
- OneLakeMirrored tables shortcut
- lh_goldGold lakehouse 06:00 build, then model refresh
- UtilizationSemantic model
Closed. The model now says 4,420. The app, the reports and client PDFs agree.
Pinecrest Senior Living
PublishedReport preview · utilization summary
| Row | Q4 2025 | Q1 2026 | Q2 2026 | Q3 2026 |
|---|---|---|---|---|
| Covered lives | 4,020 | 4,090 | 4,150 | 4,420 |
| Case utilization | 12.1% | 11.2% | 11.8% | 10.8% |
| Program utilization | 30.8% | 31.1% | 32.4% | 29.6% |
Change log
| Oct 27 4:12 PM | s.delacroix | Lives 4,180 → 4,420 | Undo |
| Oct 14 9:03 AM | o.brennan | PEPM $2.10 → $2.25 | Undo |
| Oct 9 2:40 PM | i.solberg | Run group → Quarterly | Undo |
What moves A covered-lives edit changes three report rows. Nothing else divides by it.
The edit loop. A reviewer corrects covered lives, sees the projected report, and the change mirrors into the lakehouse before the model refreshes.